INTRODUCTION
Quite often, test managers are expected to answer such questions as:
-
Why does testing take so long?
-
Why has the test process not been completed yet?
-
How many defects can I still expect during production?
-
How many re-tests are still required?
-
When can testing be stopped?
-
When will the test team start the execution of the test?
-
Tell me what exactly you are up to!
-
What is the quality of the system that you have tested?
-
When can I start production?
-
How can it be that the previous test project was much faster?
-
What did you actually test?
-
How many defects have been found and what is their status?
Answering these types of questions with well-founded, factually based answers is not easy. Most questions can be
answered with reference to the periodic reports as described in Report (AST). Such reports can
only be created on the basis of correctly recorded relevant data, which is converted into information and then used to
answer the above-mentioned questions.
Metrics on the quality of the test object and the progress of the test process are of great importance to the test
process. They are used to manage the test process, to substantiate test advice and also to compare systems or test
processes with each other. Metrics are important for improving the test process, in assessing the consequences of
particular improvement measures by comparing data before and after the measures were adopted.
To summarise, a test manager should record a number of items in order to be able to pass well-founded judgement on the
quality of the object under test as well as on the quality of the test process itself. The following sections describe
a structured approach for arriving at a set of test metrics.
GQM METHOD IN SIX STEPS
There are various ways of arriving at a particular set of metrics. The most common is the Goal-Question-Metric ( GQM)
method [Basili, 1994]). This is a top-down method in which one or more goals are formulated. For example: what
information should I collect in order to answer those questions posed in the introduction? These goals include
questions that constitute the basis for the metrics. The collected metrics should provide the answers to those
questions, and the answers will indicate among other things whether the goal has been achieved or not. The summary of
the GQM method described below focuses in particular on the test aspect. The GQM process is described in six steps.
This is a concise description that includes only those items that are relevant to the test manager. For a more detailed
description, please refer to the aforementioned GQM literature.
Step 1: Defining the goals
Measuring purely for the sake of measuring is pointless. Clear and realistic goals should be set beforehand. We
distinguish two types of goals:
-
Knowledge goals (knowing where we are now). These goals are expressed in words such as evaluate, predict, or
monitor. For example, “Evaluate how many hours are actually spent on re-testing” or “Monitor the test coverage”.
The goal here is to gain insight.
-
Improvement goals (where do we want to go). These goals are expressed in words such as increase, decrease, improve,
or achieve. Setting such goals suggests that we know there are shortcomings in the present test process or the
present environment and that we want to improve these.
An example of such an improvement goal is obtaining a 20% saving on the number of testing hours at a constant test
coverage within a period of 18 months. In order to ascertain this, the following two knowledge goals should be aimed
at:
-
Insight into the total number of testing hours per project.
-
Insight into the achieved test coverage per project.
It is important to investigate whether the goals and the (test) maturity of the organisation match. It is pointless to
aim at achieving a certain test coverage if the necessary resources (knowledge, time and tools) are not
available.
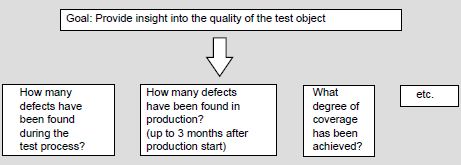
Example - Knowing where we are now - Goal: Provide insight into the quality of the test
object.
Step 2: Asking questions per goal
For each goal, several questions have to be asked. The questions are formulated in such a way that they act as a
specification of a metric. It can also be asked, for each question, who is responsible for the test metrics supplied.
From the above goal, various questions can be derived. We will limit the number of questions in this example to
three.
Example:
Step 3: From questions to metrics
The relevant metrics are derived from the questions, and form the full set of metrics, gathered during the test
process.
Example:
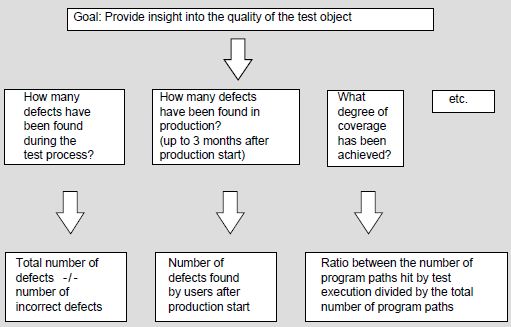
By asking the right questions, we arrive at the correct set of metrics for a certain goal. It is important to define
and specify each metric correctly. For example, what exactly is a defect?
Step 4: Data collection and analysis
During the test process a variety of data is collected. One way of keeping things simple is to use forms/templates (if
possible in electronic form). The data should be complete and easy to interpret. In the design of these forms,
attention should be paid to the following points:
-
Which metrics are collected on the same form.
-
Validation: how easy is it to check whether the data is complete and correct.
-
Traceability: forms supplied with the date, project ID, configuration management data, data collector, etc. Take
into consideration that it is sometimes necessary to preserve this data for a long time.
-
Possibility of electronic processing.
As soon as the data is collected, it should be analysed. At this point it is still possible to make corrections.
Waiting too long decreases the chance of restoring the data. Bear in mind possibilities, for example, of booking time
with the incorrect activity code.
Step 5: Presentation and distribution of the measurement data
The collected measurements are used both in the test reports on the quality of the product under test and in those on
the test process. Proper feedback is also of importance to the motivation of those involved and the validation of the
measured data.
Step 6: Relating the measurement data to the questions and goals
This last step is used to investigate to what extent the indicators (answers to the questions) offer sufficient insight
into the matter of whether the goals have been achieved. This situation may be the starting point for a new GQM cycle.
In this way, we are continually improving the test process.
HINTS AND TIPS
When metrics are being collected, the test manager should take the following issues into account:
-
Start with a limited set of metrics and build it up slowly.
-
Keep the metrics simple. The definition should appeal to the intuition of those involved. For example, try to avoid
the use of a variety of formulas. The more complicated the formulas, the more difficult they are to interpret.
-
Choose metrics that are relatively simple to collect and easily accepted. The more difficult it is to collect data,
the greater the chance that it will not be accepted.
-
Collect data electronically as much as possible. This is the quickest way of data collection and avoids the
introduction of manual errors into the data set.
-
Keep an eye on the motivation of the testers to record accurately. In the case of time registration, for example,
it sometimes happens that incorrect (read: not yet fully booked) codes are used.
-
Avoid complicated statistical techniques and models during presentations. Allow the type of presentation to depend
on the data presented (tables, diagrams, pie charts, etc.).
-
Provide feedback to the testers as quickly as possible. Show them what you do with the information.
PRACTICAL STARTING SET OF TEST METRICS
Below is an indication of what test managers embarking on a “metrics programme” should start with. The metrics set
described is a starting set that can be used in practice with little cost and effort.
-
Registration of hours, using activity codes. Register the following for each tester: date, project, TMap phase,
activity and number of hours. A “Comments” field is recommended, making it possible to check whether the data has
been entered correctly. Registering the hours in this way enables you to obtain insight into the time spent on each
TMap phase (see figure 1). It also enables the client to check the progress of the test process. It is advisable to
compile this type of timesheet on a weekly basis for projects that last up to three or four months. For projects
that last longer than half a year, this can be done on a fortnightly basis. For projects that last longer than a
year, it is best to report on a monthly basis.
-
Collect data about the test deliverables (test plans, test scripts, etc.), the test basis and test object. Record
the following: document name, delivery date, TMap phase upon delivery, version and a characteristic that says
something about the quantity. This may be the number of test cases for the test scripts, or the number of pages for
the other documents. For the test basis, the number of user requirements can be taken as a quantity characteristic.
-
Report on the progress of the defects. An example of this type of reporting is shown in figure 2:
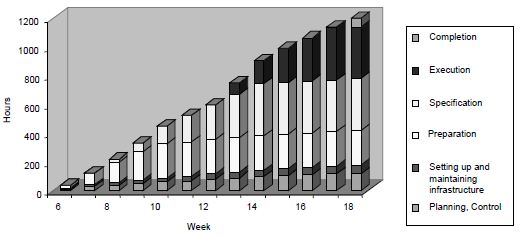
Figure 1: Example of hours spent on test process, per TMap phase
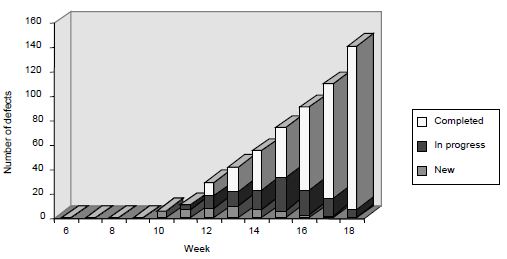
Figure 2: Example of a progress overview of defects
These elementary metrics (hours, documents and defects) can be used to assess the productivity of the test process.
Note that this productivity should be seen in relation to the required effort and size of the test project. Example: in
the first ten hours of testing we may find more defects per hour than in 400 hours of further testing, simply because
the first defects are found more quickly than the last ones.
The following metrics regarding productivity can be derived from this elementary set:
-
number of defects per hour (and per hour of test execution)
-
number of test cases carried out per hour
-
number of specified test scripts per hour (and per hour of test specification)
-
number of defects per test script
-
ratio of hours spent over the TMap phases.
If the number of function points or the number of ‘kilo lines of code’ (KLOC) of the object under test is known, the
following numbers can be calculated:
-
number of test hours per function point (or KLOC)
-
number of defects per function point (or KLOC)
-
number of test cases per function point (or KLOC).
For the test basis we can establish the following metrics:
-
number of test hours per page of the test basis
-
number of defects per page of the test basis
-
number of test cases per page of the test basis
-
number of pages of the test basis per function point.
When it is known how many defects occur in production during the first three months, the following metric can be
determined:
-
Defect-detection effectiveness of a test level: number of found defects in a test level divided by the total number
of defects present. This metric is also called the Defect Detection Percentage ( DDP). In calculating the DDP, the
following assumptions are applied:
-
all the defects are included in the calculation
-
the weighed severity of the defects is not included in the calculation
-
after the first three months of the system being in production, barely any defects are present in the
system.
The DDP can be calculated both per test level and overall. The DDP per test level is calculated by dividing the number
of found defects from the relevant test level by the sum of this number of found defects and the number of found
defects from the subsequent test level(s) and/or the first three months of production. The overall DDP is
calculated by dividing the total number of found defects (from all the test levels together) by the sum of this number
of found defects and the found defects from the first three months of production.
Example - DDP calculations
|
Test level
|
Found defects
|
|
System test (ST)
|
100
|
|
Acceptance test (AT)
|
60
|
|
3 Months of production
|
40
|
DDP ST (after the AT is carried out) : (100 / 100+60 ) = 63%
DDP ST (after 3 months of production) : (100 / 100+60+40 ) = 50%
DDP AT (after 3 months of production) : (60 / 60+40 ) = 60%
DDP overall : (100+60 / 100+60+40 ) = 80%
Some causes of a high or low DDP may be:
-
High DDP
-
the tests have been carried out very accurately
-
the system has not yet been used much
-
the subsequent test level was not carried out accurately.
-
Low DDP
-
the tests have not been carried out accurately
-
the test basis was not right, consequently nor were the tests derived from it
-
the quality of the test object was wrong (containing too many defects to be found during the time
available)
-
the testing time has been shortened.
By recording the above-mentioned metrics, supplemented here and there with particular items, we arrive at the following
list of metrics.
METRICS LIST
In the following (non-exhaustive) list of metrics, a number of commonly used metrics are mentioned, which can be used
as indicators for pronouncing on the quality of the object under test or for measuring the quality of the test process
and comparing against the organisation’s standard. All the indicators can of course also be used in the report to the
client:
-
Number of defects found - The ratio between the number of defects found and the size of the system per unit of
testing time.
-
Executed instructions - Ratio between the number of tested program instructions and the total number of program
instructions. Tools that can produce such metrics are available.
-
Number of tests - Ratio between the number of tests and the size of the system (for example expressed in function
points). This indicates how many tests are necessary in order to test a part.
-
Number of tested paths - Ratio between the tested and the total number of logical paths present.
-
Number of defects during production - This gives an indication of the number of defects not found during the test
process.
-
Defect detection effectiveness - The total number of defects found during testing, divided by the total number of
defects – estimated partly on the basis of production data.
-
Test costs - Ratio between the test costs and the total development costs. A prior definition of the various costs
is essential.
-
Cost per detected defect - Total test cost divided by the number of defects found.
-
Budget utilisation - Ratio between the budget and the actual cost of testing.
-
Test efficiency - The number of required tests versus the number of defects found.
-
Degree of automation of testing - Ratio between the number of tests carried out manually and the number of
tests carried out automatically.
-
Number of defects found (relative) - The ratio between the number of defects found and the size of the system (in
function points or KLOC) per unit of testing time.
-
Defects as a result of modifications that are not tested - Defects because of modifications that are not tested, as
a part of the total number of defects arising as a result of changes.
-
Defects after tested modifications - Defects because of modifications that are tested, as a part of the total
number of defects arising as a result of changes.
-
Savings of the test - Indicates how much has been saved by carrying out the test. In other words, what would the
losses have amounted to if the test had not been carried out?
|
